This post is all about an incident that (luckily) occurred in one of our staging instances regarding a large Rails application with lots of background processing via Sidekiq that caused loads of Heroku R14 (Memory quota exceeded) errors.
Background
At my work, our application interfaces with lots of third parties and occasionally needs to do so asyncronously and in large-ish batches (~5,000 or so records at a time). Obviously, this type of work is handled asyncronously and in the background. I’ve mentioned before that the Rails monolith I work on is pretty old, and it uses Delayed::Job as its job queuing system. Over time, a nice UI got built on top of the standard DJ stuff with developer shortcuts to help see what’s running, what’s failing, and restart those jobs as necessary.
Recently, all of our newer Rails applications have started to be set up with Sidekiq – it’s super simple to get up and running and works great. So far we all really like it quite a bit. There have been some minor hiccups and a bit of a learning curve compared to the tried-and-true DJ setup, but it’s been a net positive to have our job queueing service in memory with Sidekiq (it’s backed by Redis, for those out of the loop).
As I’ve alluded to before, all the apps in question are hosted on Heroku – we don’t have a dedicated devops team so this is a good way to let experienced devs manage deployments and configuration easily. One feature we use quite a bit is review apps – each time we cut a PR, a new instance of the application gets provisioned with a unique URL, which we set as the PR number on GitHub. QA loves this, as they get to isolate specific changes in each review instance, and the postdeployment script we write sets up each review instance the same way, so the test plan never has to change.
I won’t get into a huge background of how this works (the gist is to supply a Procfile and application configration in a application.json). Suffice to say each instance gets provisioned with a Redis instance that Sidekiq can hook into for job queueing.
Problems Arise
The initial development of this new Rails application went smoothly at first. It’s filling sort of an API gateway type of role where it facilitates communication between other internal applications and microservices as well as third party integrations, so there’s very little front-end and most of our work is done within Sidekiq workers.
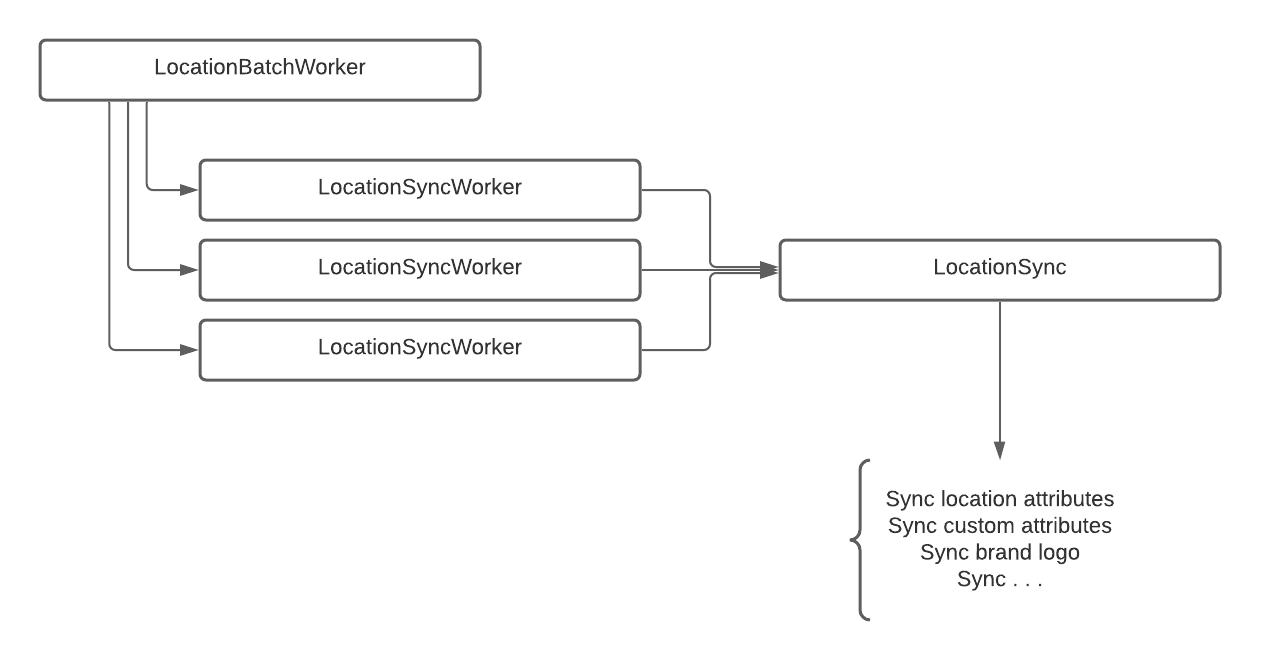
As I mentioneed before, some of these jobs can get quite large, make multiple API calls, etc. A good example of what this code might need to do would be to update location attributes nightly in a vendor application. This might include the location attributes, any custom attributes set up, associated product IDs, set a brand logo, you get it. There’s a lot going on. We batch the whole job, and then we tried to break this out as much as we could into individual workers, but there’s a lot of locations, probably on the order of a handful of thousands. Lots of large jobs can get complicated quickly.
A little of the code architecture might look something like this:

As our sync code grew larger, our jobs became heavier and heavier, and problems began to crop up.
One afternoon – a Friday, of course – a QA engineer pinged our Slack channel that our main staging/QA review instance was stuck on an import workflow (which looks a lot like the diagram above but is for inflow of data into our application instead of out). I think it might have been related to sales data, so it was a big deal.
Developers jumped in to see what was wrong, but by the time we had noticed the issue we had thousands of jobs backed up in Sidekiq’s Scheduled queue.
Diagnosis
Firstly, let me say we were fortunate that this cropped up in a QA environment and not production, else this would have been a much bigger fire.
At first, looking at our application logs we noticed a lot of R14 (Memory quota exceeded) errors as mentioned before. That led us to believe that our code had a memory leak in it somewhere. When this happened, the worker was stopped by Sidekiq and sent to the scheduled queue, where it would never successfully complete – the next job would do the same thing. We restarted the worker dynos in order to release all the memory and then spooled them back up again – issue resolved, hunch confirmed.
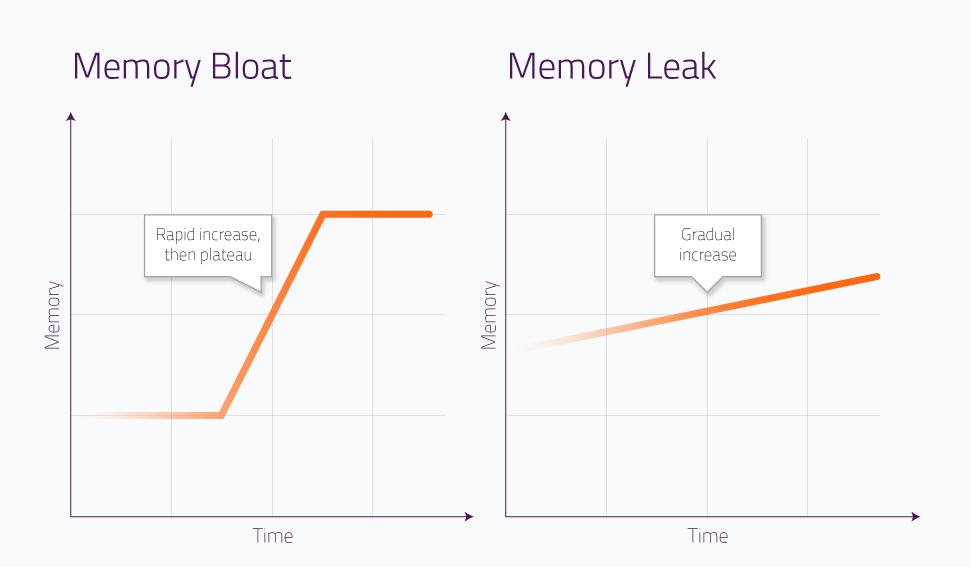
Well, more specifically it was probably memory bloat, where we loaded a whole bunch of stuff into memory and then it just wasn’t ever released.
This was sort of confirmed when we looked at the metrics in Heroku. We expected to see a linear slope on our memory profile, which would have indicated a leak. Instead, we got a stair step pattern, indicating bloat:
 (Credit: https://scoutapm.com/blog/memory-bloat)
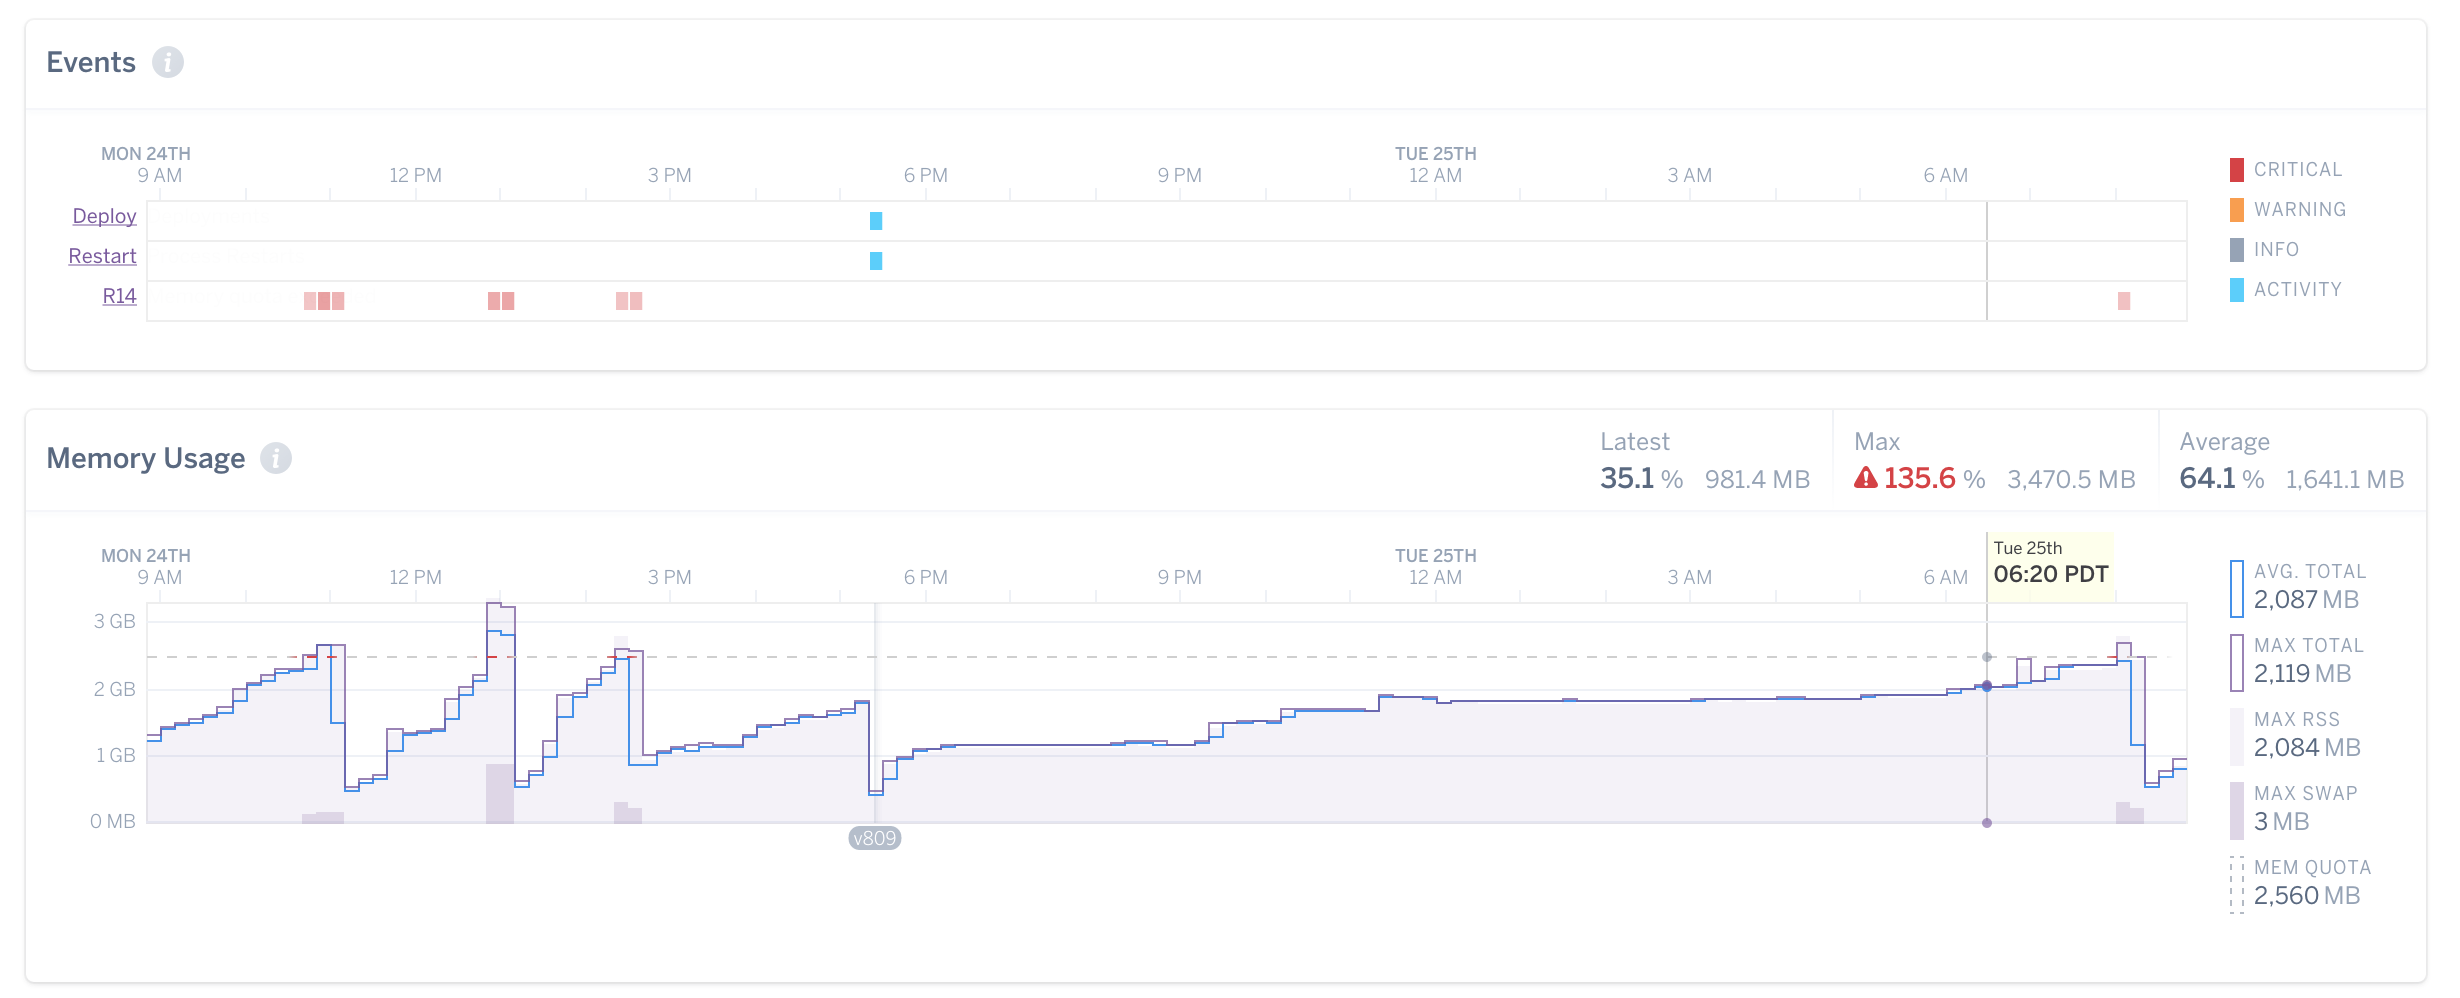
And an example of what that might look like in Heroku:
 (Credit: https://blog.bitwrangler.com/2016/10/27/memory-leak-whack-a-mole.html)
Notice at around 9PM how the stair-step pattern levels off. That’s bloat!
I won’t go into a ton of detail around why this is a common occurrence in Sidekiq installations, but suffice to say there’s not usually a ton that could be done about it, at least without significant effort.
The Bandaid
Since this isn’t wholly uncommon, the author of Sidekiq actually has a recommendation on taming Rails memory bloat on his blog.
Memory fragmentation seems to be the cause, and while that’s a topic that’s probably too in-depth to get into here (you can read about it here, though!), we did attempt the two fixes suggested by Mike.
Set MALLOC_ARENA_MAX=2 in Heroku Environment Variables
We did this manually, and then it turns out this is done by default on new Heroku applications.
Womp womp.
No change.
Use jemalloc
If at first you don’t succeed by configuring your existing garbage collector, just install a new one instead!
This one was marginally more difficult. To add new system dependencies to a Heroku application you have to use a buildpack that includes it. Conveniently, there is one, so I added it manually, rebuilt our review instance, and tested it out.
Still no change. No surprise, we’re running a LOT of heavy jobs here.
Write a Tool to Restart Worker Dynos
This was our least favorite option, but one that we ended up having to resort to. We took inspiration from GitLab, as they appear to be having the same problem. Their solution was to run a worker that periodically checks whether its process is using too much memory, and if so, kill it.
We opted for something a little simpler: hook into Sidekiq middleware after a job’s finished processing and do the same thing on a smaller scale.
Code for our Sidekiq::MemoryKiller middleware
The parts are simple. They require a little config in Heroku environment variables:
- Required:
HEROKU_API_TOKEN- Needed for accessing Heroku API to issue a dyno shutdown/restart command
- We created a new account with minimal permissions just for this purpose
HEROKU_APP_NAME- This gets set by Heroku in all review apps
- For others, we manually add this with
staging-app-name,qa-app-name, etc.
DYNO- This is ALWAYS set by Heroku and identifies which dyno the process is running on
- Optional:
SIDEKIQ_MEMORY_KILLER_MAX_RSS- Defaults to 0 (off)
- max Resident Set Size, essentially memory usage in KB
SIDEKIQ_MEMORY_KILLER_GRACE_TIME_IN_SECONDS- Defaults to 120 (2 minutes)
- attempt to let our workers finish within this time frame
Next, we’ll just add the middleware to Sidekiq:
Sidekiq.configure_server do |config|
  config.server_middleware do |chain|
    # Automatically restart Heroku dynos when memory increases.
    if Rails.env.staging? || Rails.env.production?
      chain.add Sidekiq::Middleware::MemoryKiller
    end
  end
end
Note that we only want this running on Heroku dynos – hence checking what Rails.env we’re in. Once it’s up and running, it’s quite simple – after every job, check the RSS of the dyno by shelling out to ps. If it’s over the configured amount, send a restart command via the PlatformAPI class (Heroku’s API gem). The only twist is the mutex to make sure this only happens once, otherwise we’d get stuck restarting over and over!
Wrap Up
I should note that Heroku automatically cycles their dynos at least every 24 hours, so it’s not like they never get restarted automatically before this middleware was created. It’s just that we definitely needed an automated solution to this problem beyond those scheduled restarts.
That’s all for now! Thanks for reading!
- ← Previous: On Keeping a Physical Engineering Notebook
- Next: Kata, Kumite, and Code Golf for Algorithm Practice →
